
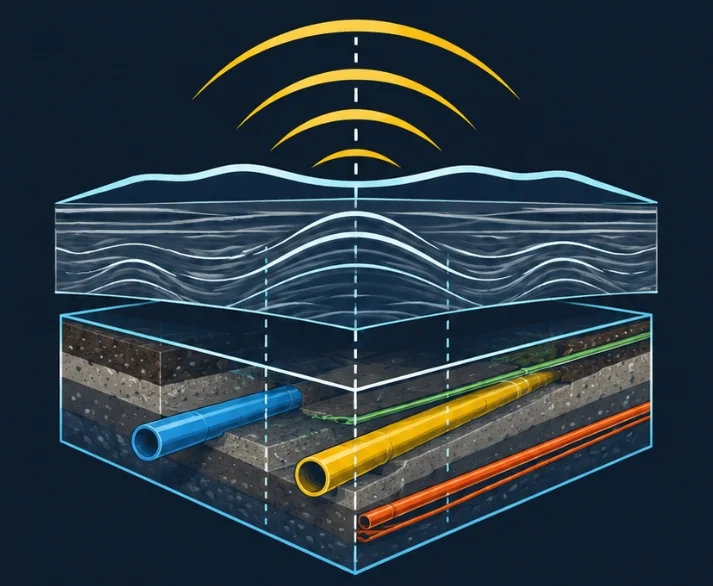

Interpretation means hours in the office.
On site, the GPR records in minutes. Then someone has to read every radargram, pick every hyperbola, link the lines together and draw it all on the plan.
- Manual picking depends on the surveyor's eye and how tired they are.
- A utility crossing the lines at an angle gives a wider hyperbola: read on its own, it throws the depth off.
- The plan has to come out in the right coordinate system, with an uncertainty you can justify.
How it works
Three steps, nothing to install.
You upload the raw files
A .zip archive with your .DZT line files, plus the .DZG files if the survey was positioned with GNSS.
Radar Plan 3D processes them
Signal clean-up, hyperbola detection on every line, linking the lines in 3D, ground velocity estimated from the data, correction for utilities crossed at an angle.
You get the plan
A DXF with every utility in 3D, its depth and its confidence level, plus a CSV table, a GeoJSON file and a PDF report.
What Radar Plan 3D finds on a site where the truth is known
Measuring accuracy needs ground truth. On this simulated 10 × 6 m site (40 lines, stones, soil layers, noise) the real utilities are known to the centimetre.
| Real utility | Found | Depth error |
|---|---|---|
| Gas, steel Ø120, at an angle | 100 % | 3.7 cm |
| Water, PE Ø160 | 100 % | 4.5 cm |
| Low-voltage cable, sloping | 100 % | 2.2 cm |
| Sewer PVC Ø200, with a bend | 100 % | 2.9 cm |
| Telecom duct | 100 % | 1.6 cm |
Median error on the top of the utility. Results on simulated data; Radar Plan 3D has also been tested on public real surveys. To judge for yourself, run it on one of your sites already checked by trial holes.
What you get
- DXF plan
- Every utility as a 3D polyline, on separate layers by confidence: confirmed, probable, to verify. The GPR lines on a layer of their own.
- Depth and uncertainty
- Depth to the top of the utility at every point, and a plan-position uncertainty worked out for each utility.
- Coordinate system
- Picked automatically: British National Grid (OSTN15 grid) in Great Britain, NAD83(2011) / UTM in the United States, Lambert-93 in France. Without GNSS: the survey's local grid.
- Input formats
- GSSI GPRs: .DZT, .DZG (GNSS) and .DZX files, single and dual-frequency antennas such as the UtilityScan DF. MALA, Sensors & Software and IDS: in preparation.
- PDF report
- Plan, utility table, ground velocity estimated from the data compared with the one entered by the operator.
- Your data
- Raw files are deleted from the server as soon as processing ends. Results stay available to download for 30 days.
Where the method comes from
Radar Plan 3D grew out of sonar echo processing for seabed mapping. The problem is the same under the sea and under the road: echoes buried in noise, a propagation velocity you don't know in advance, a GNSS position to tie to every measurement.
The method never decides on one line alone. A single hyperbola can be a stone; a utility shows up again from line to line, aligned, with the same ground velocity. For each utility Radar Plan 3D computes the probability that the alignment is down to chance, and that number ranks it as confirmed, probable or to verify.
It remains a tool: the plan handed to the client stays the responsibility of the surveyor, who checks it.
Founded by Kais Trabelsi, developer of marine mapping and signal processing software.
Pricing
Prepaid credit, charged per metre processed. The cost is shown before processing; if processing fails, nothing is charged.
Minimum £22 / $27 per site. Example: 280 m of lines, £36.40.
£50 / $50 of credit when your account opens, so you can judge the results yourself.
Credit is topped up by bank transfer, against an invoice.
Prices exclude taxes. Also available in euros.
Try it on a site you know.
Email us: you get an access key with free credit. Upload the raw files of a site already checked by trial holes or potholing, and compare.